Graph based FCD lesion segmentation - a MELD study
Focal Cortical Dysplasia (FCD) are small abnormalities occuring during brain development that can cause epileptic seizures. Identifying these lesions on MRI and removing them surgically can often cure epilepsy. However, FCDs are frequently subtle and difficult to detect, and up to half are missed by radiologists.
Previously, our group developed MELD FCD an AI model trained on a large, multicentre MRI dataset of epilepsy patients and controls. The model can detect 67% of FCD lesions, but typically produced around two false-positive clusters per subject. This is a common challenge in lesion-detection AI models, which increases the radiologist’s workload as they need to review more putative lesions.
In work published in published in JAMA Neurology in 2025, the Multi-centre Epilepsy Lesion Detection (MELD) Project introduced a new graph-based AI model with substantially improved accuracy.
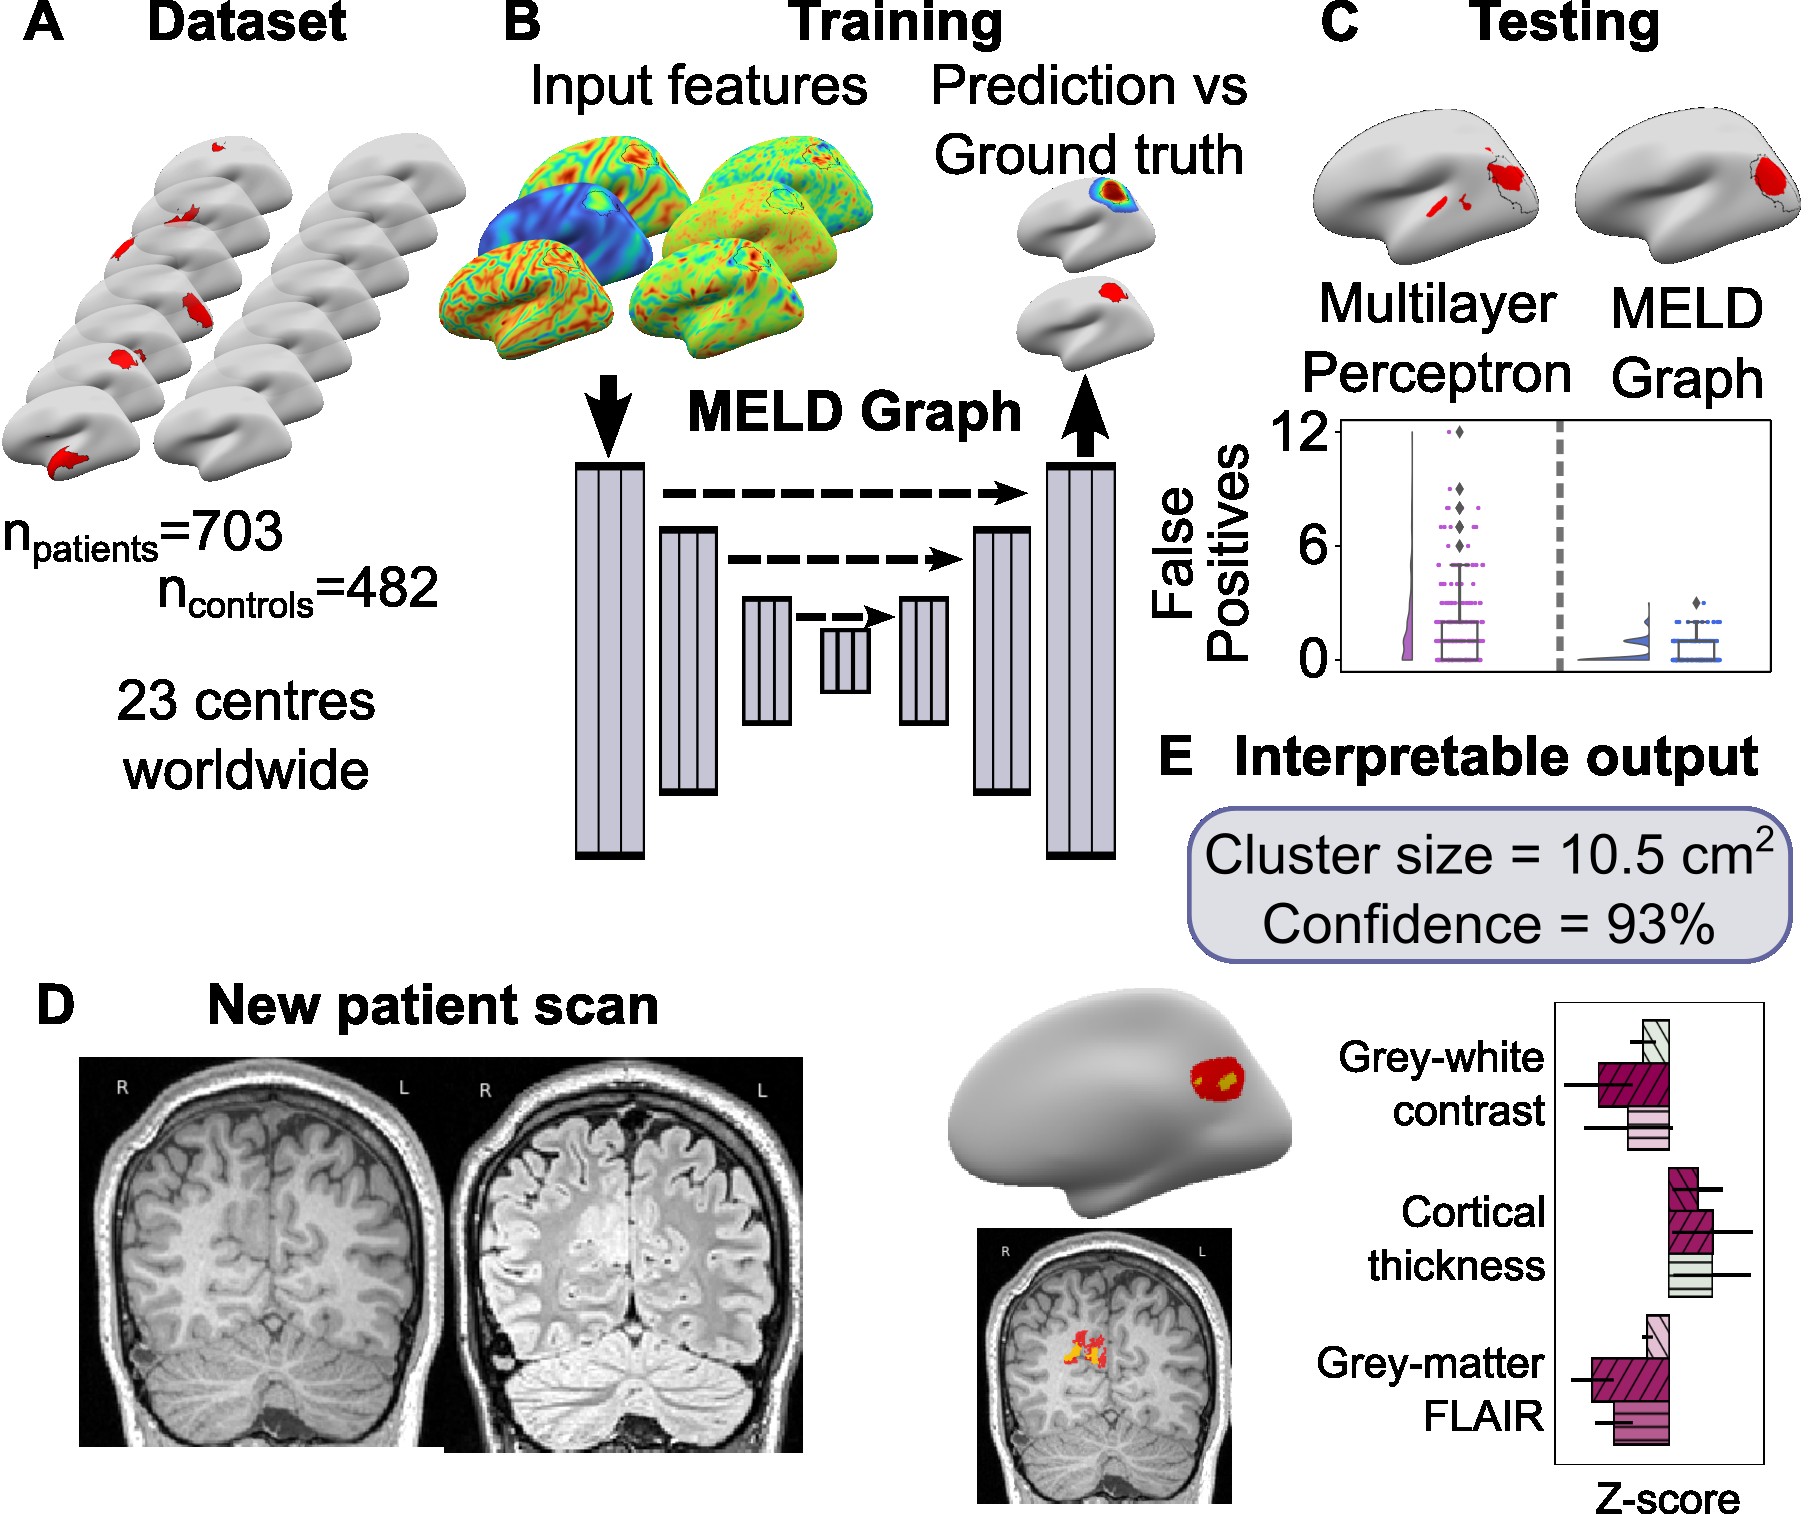
To build this model (MELD Graph), we used a graph neural network trained on surface-based cortical features. Unlike the previous multilayer perceptron (MLP) approach, which analysed each cortical vertex independently, the graph neural network take into consideration neighbourhood information, makink the model more aware about the surrounding tissue.
To allow direct comparison, MELD Graph was trained and evaluated on the same multicentre dataset of 703 patients described in the original publication.
Results
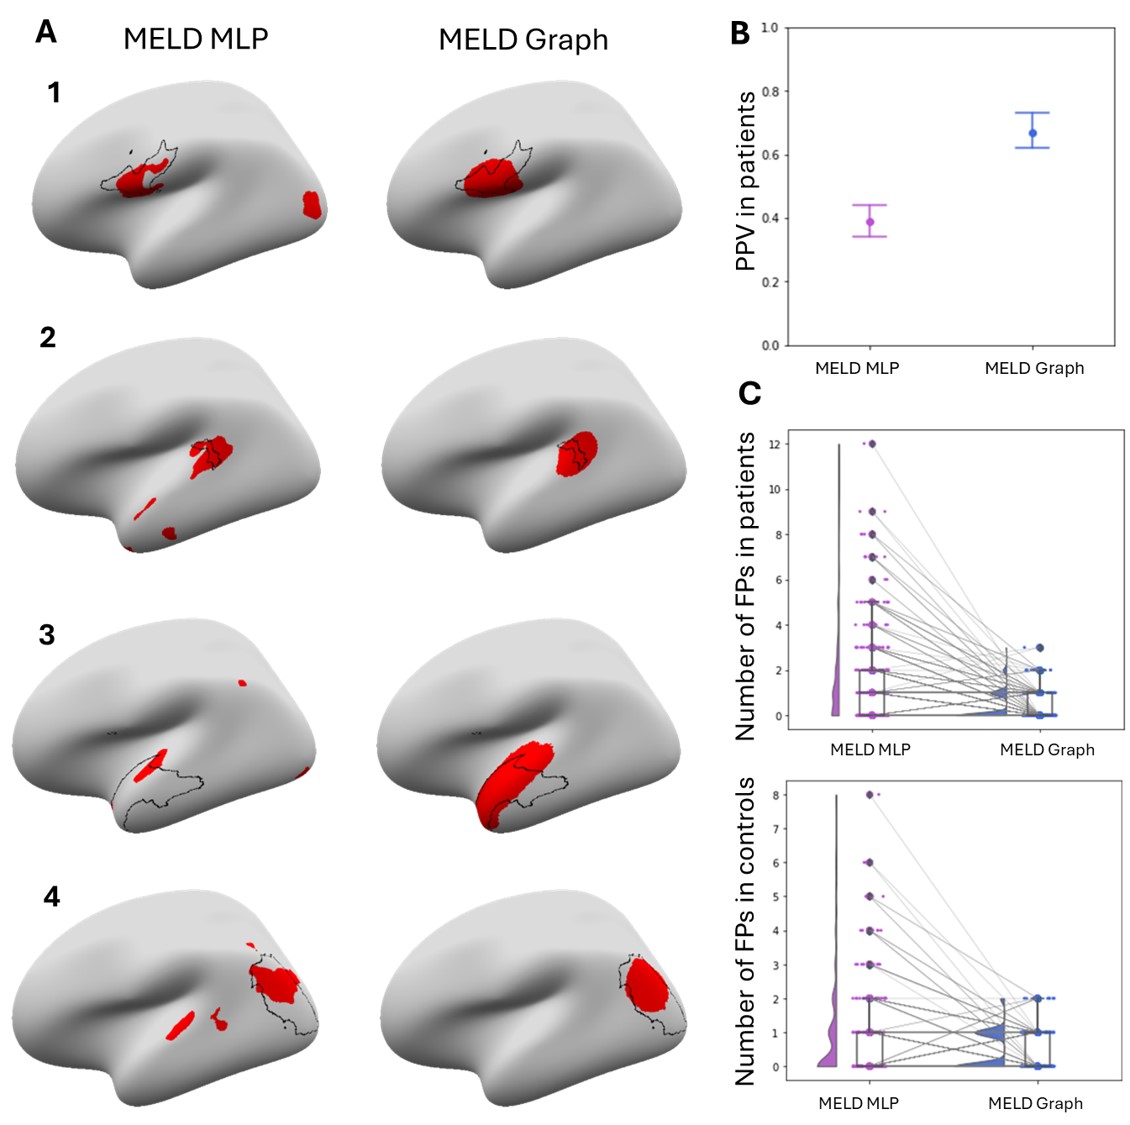
In the test dataset (n=260 patients), MELD Graph achieved 67% accuracy (70% sensitivity; 60% specificity), compared with 39% accuracy (67% sensitivity; 54% specificity) for the earlier MELD MLP model. Importantly, MELD Graph produced zero false-positive predictions on average. Along with the predicted lesion, MELD Graph also generates interpretable reports describing lesion location, size, salient features, and a confidence score.
Below are examples showing MELD Graph vs. MELD MLP predictions and the reduction in false positives:
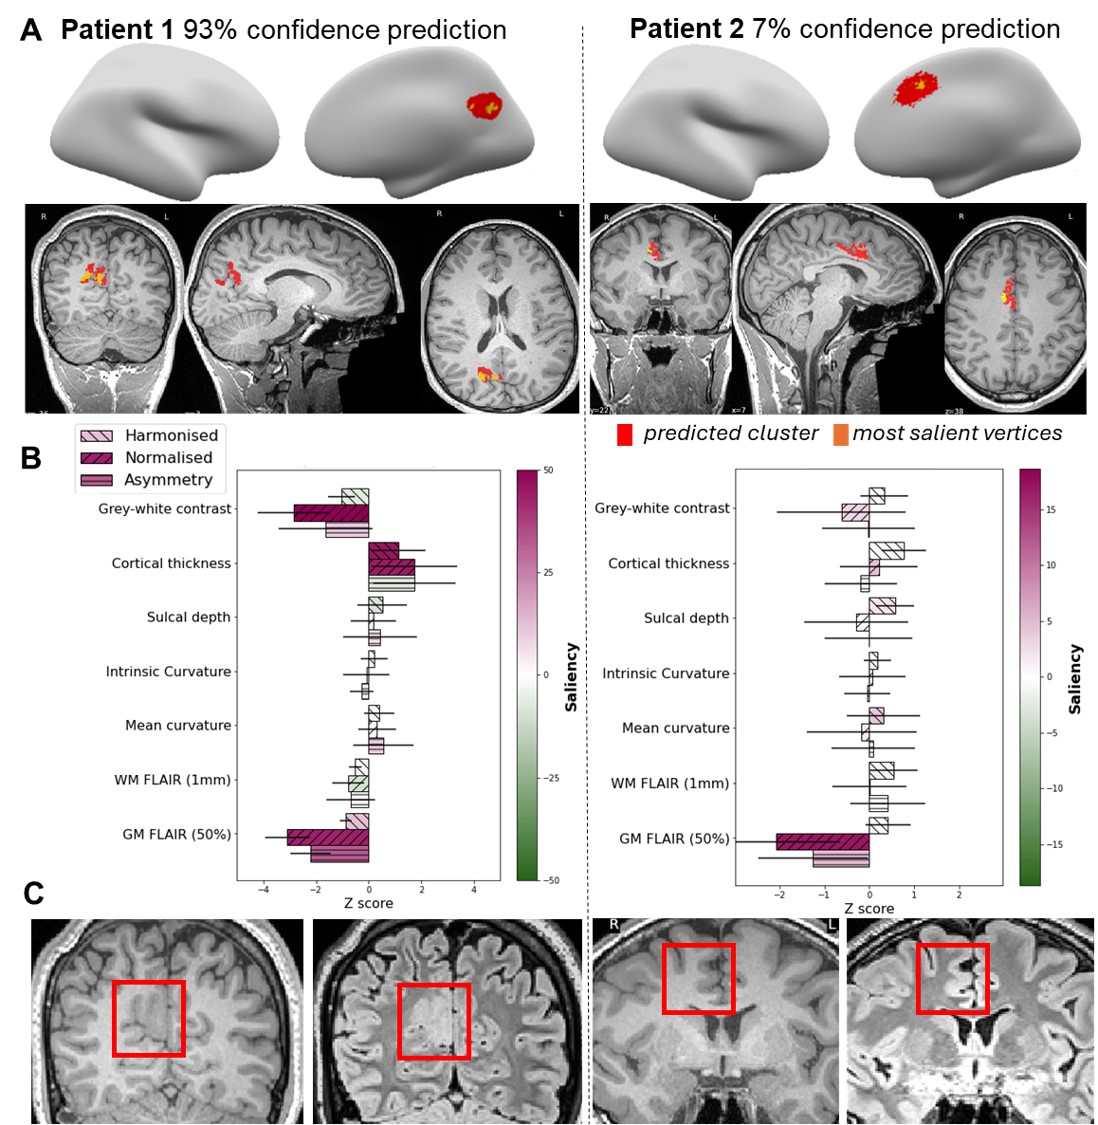
Running the pipeline on new patients
The pipeline outputs an individualised patient report including predicted lesion location, imaging features, saliency values, and a confidence score. Predicted lesions are also mapped back to the native T1 image for radiological review.
MELD Graph worldwide use
MELD Graph is open-source and available on macOS, Windows, and Linux via Github. Tutorial videos to help install and uses the tool are available on our Youtube channel
As of December 2025 (10 months after publication), it is reported to be in use in more than 100 hospitals worldwide as a research tool. Our work has also been featured in the news, including coverage by the BBC and Reuters.
Written with the assistance of ChatGPT